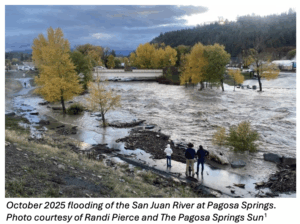
San Juan River Flooding Shocks Archuleta County
Executive Summary
Purpose of the report: This rapid assessment, produced by the Western Water Assessment (WWA), serves as a scientific resource for understanding drivers and impacts of the flooding events that occurred from October 10th -14th, 2025 in southwest Colorado. The report is designed to support local resilience building efforts and hazard planning for communities in the region. It provides the long-term and recent historical context for the flooding, hydrologic characteristics of the flood event, and an assessment of the local probability of an event of this magnitude.
Key Findings:
- The October 10th-14th, 2025 floods were the 3rd largest on record for Pagosa Springs, CO, with river levels reaching a maximum gauge height of 12.82 feet and peak flow rates of 8,570 cubic feet per second
- A total of 12.5 inches of precipitation fell at a high-elevation observation site in the watershed over 5 days, saturating the watershed and driving the river to reach Major Flood stage twice in that period
- Flood frequency analysis based on historical observations of runoff in Pagosa Springs suggests this flood has a return period of 25 to 40 years, meaning that there is a 2.5-4% likelihood of a flood of similar magnitude occurring in any given year.
- Early reports following the flooding suggest that hundreds of residents and households were evacuated in Pagosa Springs and surrounding rural communities and many structures were damaged or destroyed by the floods including homes, bridges, and roadways.
- Nearly two decades of exposure to drought conditions, increasing wildfire activity, and now the recent flooding collectively highlight the geographically unique and increasingly frequent natural hazard risks that rural mountain communities face in southwest Colorado.
Supporting future resilience: Understanding the drivers, characteristics, and likelihood of extreme events like the floods of October 2025 is crucial for effective resilience planning. Scientific analysis that is tailored to local communities, like this assessment for Pagosa Springs and Vallecito, provides specific, actionable information that planners and residents can use to understand their unique exposure to hazards. The Western Water Assessment (WWA) is committed to providing usable science to support hazard planning and response in communities across Colorado, Utah, and Wyoming.
For further information on how WWA can support your community, please reach out to our team at wwa@colorado.edu 2
Contents
Introduction ………………………………………………………………………………………………. 2
Historical Context for Fall Flooding in Pagosa Springs …………………………………………. 2
Hydrologic Pre-Conditions of the Event ……………………………………………………………. 5
Hydrology of the Event………………………………………………………………………………….. 6
Regional Flood Impacts ………………………………………………………………………………… 9
Antecedent Moisture and Flooding ………………………………………………………………….. 9
Attributing Historical Flood Risk ……………………………………………………………………..10
What’s Next ……………………………………………………………………………………………….12
Acknowledgments ………………………………………………………………………………………12
Data Sources, Methods, and Notes …………………………………………………………………12
References ………………………………………………………………………………………………..14
Introduction
This rapid assessment is provided to serve as a scientific resource for the extreme flooding events that impacted the southwestern Colorado region from October 10th-14th, 2025. Flood impacts were felt across southwestern Colorado, especially in Pagosa Springs along the San Juan River and in La Plata County along Vallecito Creek. These recent flooding events were historic in magnitude (3rd largest flood on record for the Pagosa Springs area, 2nd largest flood on record for Vallecito Creek) and follow over two decades of drought conditions and increasing wildfire activity in the region. Extreme events like this illuminate the growing risk of natural hazards and the need for building resilience across rural mountain communities. This report is particularly focused on the extreme flooding that occurred in the Pagosa Springs area.
This assessment was conducted by the Western Water Assessment (WWA), a university-based applied research program that includes experts in hydrology, atmospheric science, community resilience, and other topics. The WWA team’s mission is to help communities across Colorado, Wyoming, and Utah make the best use of science to manage for natural hazard impacts, which is supported by an understanding of the risks and impacts of extreme events such as the flooding described in this report. While this assessment primarily focuses on physical hazards, these flood events had significant community impacts, and our thoughts go out to all that were impacted.
Historical Context for Fall Flooding in Pagosa Springs
Pagosa Springs, CO (elevation 7,110’ and population of just under 1,800) is a popular destination for its natural hot springs and access to mountain recreation activities like fishing, rafting, hiking and skiing. Like many of the mountain communities across the Western U.S., the proximity and use of the 3
surrounding natural amenities are deeply connected to the local culture and are an important component of the local economy. Flooding events of the magnitude seen in October 2025 are rare for this region, but not unprecedented and typically caused by rain events from decaying tropical Pacific storms.
The San Juan River watershed above Pagosa Springs is an area of ~270 square miles (~700km2) nestled in the San Juan Mountains of southwest Colorado (Figure 1). The hydroclimate of the watershed above Pagosa Springs is emblematic of the semi-arid mountains of southwest Colorado and northwest New Mexico, with a majority of the annual runoff in the San Juan River coming from a winter snowpack that feeds the annual pulse of water in April through the early-mid summer. During late summer and early fall the San Juan River flows are usually low, but occasional monsoonal rains and remnants of tropical storms have historically delivered pulses of precipitation that can generate significant spikes in runoff.
Figure 1. Map of the watershed that contributes to the San Juan River above Pagosa Springs. The map shows the area where falling precipitation would contribute to runoff that flows through the city of Pagosa Springs (red polygon), the municipal boundaries of Pagosa Springs (orange polygon), the precipitation monitoring stations used for the analysis in this report (Steven’s Field-blue point; Wolf Creek Pass-light blue point), the USGS stream gauge located in Pagosa Springs (green point), and the path of the San Juan River and its tributaries (light blue line). 4
Only three floods in Pagosa Springs have exceeded the minor flood stage of 10.5 feet: the flood of record in 1911, and floods in 1927 and 2025. The 1911, 1927, and 2025 floods crested at heights of 17.8, 13.5, and 12.8 feet. Little information is available about impacts of the 1927 flood, but the 1911 flood washed out the bridge and destroyed 20 structures in Pagosa Springs.
The October 1911 flood of the San Juan River in Pagosa Springs flooded many homes as the river crested at nearly 18 feet. (The Pagosa Springs Sun, October 16th, 2025)1
While annual peak flows on the San Juan River in Pagosa Springs are typically caused by snowmelt, the most extreme floods in the historical record were all caused by high intensity precipitation events that were mostly due to monsoonal or post-tropical cyclone storms (Table 1). The 1911 flood was caused by heavy rainfall, likely tropical in origin, and 3.5 to 4 inches fell in the region on October 4th-5th, 1911. The flood on the San Juan was part of a larger rain and flood event in the Four Corners region that also caused flooding on the Animas, Huerfano, Rio Grande and San Miguel Rivers. While both the 1911 and 2025 flood events occurred during September and October, the 1927 event was caused by heavy rainfall in late June and may have been accompanied by snowmelt from high elevations. The fourth highest flow on record (1970) did not reach minor flood stage but also occurred following a September heavy rain event. 5
Table 1. Top ten highest peak flows and gauge heights for the San Juan River at Pagosa Springs, CO. Events with multiple causes list the primary cause first. (data from https://nwis.waterdata.usgs.gov/nwis/peak?site_no=09342500&agency_cd=USGS&format=html) 2
Hydrologic Pre-Conditions of the Event
The San Juan River basin above Pagosa Springs was in moderate drought, in the lowest 20th percentile of historical moisture levels, during early October 2025 (U.S. Drought Monitor, October 7th, 2025, https://droughtmonitor.unl.edu/Maps/MapArchive.aspx). The Millennial Drought of the Western U.S. began in 2002 and was the most intense in the Upper San Juan River basin from 2002-2007, 2012-2015 and 2018 to present (Figure 2). Many of the last eight years of drought were experienced as extreme to exceptional drought in the basin, and drought was briefly alleviated during late 2024 through the early spring of 2025.
Figure 2. U.S. Drought Monitor time series (2000-2025) for the Upper San Juan River basin. Drought categories indicate the relative dryness of the atmosphere and land-surface compared to the historical record using a convergence of evidence approach developed by the U.S. Drought Monitor. (USDM Time Series, https://droughtmonitor.unl.edu/DmData/TimeSeries.aspx) The U.S. Drought Monitor is jointly produced by the National Drought Mitigation Center at the University of Nebraska-Lincoln, the United States Department of Agriculture, and the National Oceanic and Atmospheric Administration. Map courtesy of NDMC. 6
Winter 2025 brought below average snowpack, and runoff was a paltry 42% of average on the San Juan River at Pagosa Springs. Dry conditions reduced San Juan River streamflow to less than half of median throughout spring and summer 2025. During three rain events between late August and early October, between one to four inches of rain fell, raising flows to near median and causing an increase in soil moisture from 48% of median in late August to 91% of median in early October. Wetter soils that approached average conditions before the October 10th-14th rain events meant that a greater portion of precipitation would go directly to runoff rather than wetting dry soils.
Hydrology of the Event
The first wave of the flood event began with the onset of precipitation falling in the San Juan River above the Pagosa Springs watershed (Figure 1) during the late evening of October 9th, which continued through most of the day on October 10th. During this time, a total of 1.02 inches of precipitation fell near the city of Pagosa Springs and 2.59 inches fell in the high elevation regions of the San Juan River watershed in the San Juan Mountains (Figure 3). This first full day of precipitation saturated the soils of the watershed above Pagosa Springs, meaning additional precipitation to come would primarily flow directly into the San Juan River.
Figure 3. Observed precipitation near Pagosa Springs and in the high elevation region of the San Juan River basin. Hourly precipitation (left vertical axis) at the Wolf Creek Pass and Steven’s field station are shown as light-blue and dark-blue bars respectively. Total accumulated precipitation starting October 9th (right vertical axis) is shown as a line with the same color scheme.
A break in precipitation during the night of October 10th was followed by near constant precipitation across the watershed in the early morning and throughout the next day, leaving a two-day total of 2.8 inches of precipitation near the city of Pagosa and 7.6 inches near Wolf Creek Pass. This heavy inundation of precipitation, particularly in the high elevation region of the basin, coincided with a steep rise in the river levels for the San Juan River in Pagosa Springs (Figure 4). The river reached Minor Flood stage (10.5 ft) at 3:30pm MDT on October 11th and climbed to Major Flood stage (12.6 ft) in just under two and a half hours, causing the river to flow out of its banks and into the floodplain, damaging roadways and water infrastructure 3. The flood levels peaked at 6pm MDT in Pagosa Springs at 12.66 ft gauge height, effectively tripling the height of the river from just one day earlier (3.8 ft). At the time of peak flooding on October 11th, the river discharge was 8,270 cubic feet per second (cfs), a flow rate 94 times larger than the daily maximum flow rate of the San Juan River prior to the onset of the precipitation on October 9th. 7
Figure 4. Hydrology of the flood events in Pagosa Springs from October 9th – 14th. Observed height of the water levels (left vertical axis) at the USGS stream gauge in Pagosa Springs is shown as the solid green line, with hourly precipitation that fell in the watershed above the gauge shown as blue vertical bars (right vertical axis). Flood stage thresholds are shown as horizontal dashed lines.
The watershed experienced a slight reprieve in the precipitation on October 12th, accumulating only 0.26 inches of precipitation in the morning near Pagosa Springs and slightly more in the mountains. San Juan River levels dropped below Minor Flood Stage during the morning of October 12th and continued a slow decline through the morning of October 13th.
The full flooding event was not over yet. Continuous rainfall started in the late morning on October 13th and persisted through the morning of October 14th, initiating the river to reach even higher flood levels than were observed over the previous two days. The river again reached Minor Flood stage (10.5 ft) by 4pm on October 13th and Major Flood stage (12.6 ft) by 4am the following morning. The river would stay above that threshold for the next 4 hours. The second flood peak reached its maximum of 12.82 ft at 5:15am; at that time, 8,570 cubic feet of water was passing through the USGS stream gauge each second on the San Juan River in Pagosa Springs.
The watershed had received 4 to 5 inches of precipitation near the city of Pagosa Springs over the five days preceding the second flood peak (Figure 5) and 12.5 inches of precipitation in the mountains of the watershed that feeds into the city. Rain over the five-day period originated from the decaying remnants of Tropical Storms Priscilla and Raymond (for a detailed discussion of the meteorology for this event, see the Colorado Climate Center post 4). From October 10th-14th, 2025 (a period of 5 days), 1.5 billion cubic feet of water flowed through the San Juan River at Pagosa Springs. 8
Figure 5. Five-day precipitation (October 9th-14th, 2025) total for the Pagosa Springs area. (CoCoRaHs Mapping System, https://maps.cocorahs.org/)
Extreme precipitation and flooding impacted other southwestern Colorado watersheds, including the Piedra River and Vallecito Creek, the two watersheds to the west of the Upper San Juan. In the Upper Piedra watershed, 5 to 9 inches of precipitation fell over the five days ending on October 14th, 2025. Like the San Juan River in Pagosa Springs, two peak flows occurred on the Piedra. The first occurred early on October 12th with a peak flow of 4,680 cfs and the second in the early morning October 14th with a peak flow of 7,240 cfs, the second highest flow on record (Figure 6). The highest recorded flow on the Piedra River occurred during the October 1970 flood with a peak flow of 8,370 cfs.
Figure 6. Annual peak flow in cubic feet per second (cfs) from the San Juan River at Pagosa Springs, the Piedra River near Arboles and Vallecito Creek near Bayfield. Open circles indicate peak flow is due to snowmelt, closed circles indicate peak flow is due to rain, and red circles indicate peak flow from the October 2025 flood. Data from USGS National Water Information System, Peak Streamflow for Colorado.
Extensive precipitation also fell in Vallecito Creek, a drainage west of the Piedra River. A total of 5 to 9 inches of precipitation was recorded across the observation stations at a high elevation SNOTEL site and rain gauges near Bayfield. In the early morning of October 11th, Vallecito Creek flow peaked at 6,920 cfs, the second highest flow recorded in 62 years. Only the October 1970 flood exceeded the flood flow 9
on October 14th, 2025, and just barely at 7,050 cfs. The 1927 and 1911 floods likely exceeded flows recorded in 1970 and 2025 on the Piedra River and Vallecito Creek, but streamflow records only date back to the 1960s.
Regional Flood Impacts
Damage to infrastructure from the flood event was focused in two areas: Pagosa Springs in Archuletta County along the San Juan River and a rural community north of Vallecito Reservoir along Vallecito Creek in La Plata County. In Pagosa Springs, 380 residents were evacuated from low-lying areas along the San Juan River, several city streets were closed due to flooding, The Springs Hot Springs Resort was flooded, and sewage infrastructure was damaged, causing raw sewage to leak into the river.
Extensive damage occurred in a rural community north of Vallecito Reservoir where 383 homes were evacuated due to flooding from Vallecito Creek early on October 11th.5 Approximately 90 homes along Vallecito Creek were damaged, and two were completely destroyed. Many rural bridges were damaged from the flood, and a 28-mile stretch of Highway 160, between Wolf Creek Pass and Pagosa Springs, was closed on the morning of October 14th due to erosion and boulders blocking the road.
While the extreme rainfall damaged infrastructure in the region, the event bolstered regional water supplies, increasing storage capacity in several reservoirs. Vallecito Reservoir storage more than doubled from 29,000 acre-feet (af) on October 9th to 79,000 af by October 19th. Over the same period, both Navajo Reservoir on the San Juan River and Lake Powell on the Colorado River increased in storage by over 100,000 af. The early October rainfall was enough to remove drought conditions from Archuleta, Conejos, Hinsdale, Mineral, Rio Grande, San Juan and half of La Plata Counties (Figure 7).
Figure 7. U.S. Drought Monitor on October 7th, 2025 and October 14th, 2025 in Colorado. (https://droughtmonitor.unl.edu/Maps/CompareTwoWeeks.aspx). The U.S. Drought Monitor is jointly produced by the National Drought Mitigation Center at the University of Nebraska-Lincoln, the United States Department of Agriculture, and the National Oceanic and Atmospheric Administration. Map courtesy of NDMC.
Antecedent Moisture and Flooding
Soil moisture has a direct impact on the likelihood of a flood occurring in a watershed: when soil moisture is high, flooding can more easily occur. Multiple rain events sequenced together over a short period of time can serve as a bellwether for this increased flood risk (Figure 8) 6. The October 2025 flooding in southwest Colorado was a clear demonstration of the impact of multiple sequential rain events on the magnitude and duration of a flood event. The first wave of precipitation, starting on the night of October 9th and persisting through the following day, saturated the soils in the San Juan River watershed above Pagosa Springs. When the second wave of rainfall started on October 11th, the soils were saturated with water, so additional rain went directly into surface runoff flowing into the San Juan River (Figure 4). 10
Figure 8. Conceptual model of how frequent rain events influence flood probability. A study conducted by researchers of the Western Water Assessment team demonstrates how the timing, or intermittency, of precipitation could serve as a tool for flood prediction 6. *This figure was used with permission from the authors of the manuscript and can be found in its original publication here: https://www.sciencedirect.com/science/article/pii/S0048969724039718.
This soil saturation effect persisted further through October 13th, which primed the watershed to flood to an even higher level on October 14th than it had on October 11th. Notably, the amount of precipitation that was observed at the upstream stations was considerably less on October 13th than the amount that fell before the first flood peak (October 11th), but so much water was stored in the soils and channels of the watershed that the flood reached higher levels and greater flows.
Attributing Historical Flood Risk
The October 2025 flood is the third largest flood on record for Pagosa Springs; the largest being the 1911 flood which also occurred in October and had nearly triple the discharge rate of the October 2025 flood at 25,000 cfs (Figure 9). To understand the likelihood of peak flood events like this, we can apply Flood Frequency Analysis methodologies that are designed to provide emergency planners with an assessment of the range of extreme flows that they should plan for. In this assessment, we apply the methods proposed by the USGS Bulletin 17c 7 to estimate the probability of the flood events that occurred from October 11th-14th, given the historical observations of flow in the San Juan River at Pagosa Springs from 1911 through 2024. Conducting this analysis using only the information from years prior to this most recent flood event grants insight into how likely a flood of this magnitude was to occur. 11
Figure 9. Annual maximum flood magnitudes for the San Juan River at Pagosa Springs. For the San Juan River at Pagosa Springs, all observed historical peak annual flows are shown as hollow points, and the Oct 2025 flood is annotated as a star. The peak annual flows from 1914-1934 (represented by vertical bars) were not directly observed and are estimated using a historical reference of the 1927 flood, these are considered in the flood frequency analysis but not as heavily weighted in the estimation of event probability. *This figure is derived from the USGS PeakFQ web application (https://www.usgs.gov/tools/peakfq) 8 and annotated for clarity.
The return period for the October 2025 flood is estimated to be between 25 to 40 years based on annual maximum flow records for the San Juan River at Pagosa Springs, which means that probabilistically this event is likely to occur once every 25 to 40 years (Figure 10). Put another way, there is a 2.5 to 4% chance that a flood of this magnitude would occur during any given year. It is important when discussing such analyses to clarify that this is only probabilistic and not prescriptive of how often in the future flooding of this magnitude will actually occur. For example, it is entirely possible for a 40-year flood to occur two years in a row. Furthermore, this type of analysis relies on the assumption that the underlying drivers of floods (primarily precipitation intensity and quantities) will be statistically stationary in the future, which is unlikely to be a wholly valid assumption given regional trends in precipitation and temperature 9. For reference, the 1911 flood has an estimated return period of 200 years meaning that there is a 0.5% chance of a flood of 25,000 cfs occurring in any given year.
Figure 10. Flood frequency annual exceedance probability curve estimated for the San Juan River at Pagosa Springs. For the San Juan River at Pagosa Springs, the red curve represents the probability (in percentage; horizontal axis) that a flood of a given magnitude (cfs; vertical axis) or larger is likely to occur each year. The uncertainty of the statistical approach is represented by the bounding dark blue curves. All historical peak annual flows are shown as light blue points, 1927 flood that was estimated is shown as a triangle, and the Oct 2025 flood is annotated as a star. Station skew (here 1.17) is a description of the shape of the probability distribution of peak flows that occur at this specific USGS stream gauge.7 *This figure is derived from the USGS PeakFQ web application (https://www.usgs.gov/tools/peakfq) 8 and annotated for clarity. 12
What’s Next
This assessment demonstrates that the southwest Colorado flooding events of early October 2025 were extreme in terms of the magnitude of streamflow, but not unprecedented in the historical record for the region. High river levels slowly began to subside through the week following the peak flows on October 14th and efforts to recover and rebuild in Archuleta and La Plata Counties were still underway at the time of this report’s publication 10. Damage estimates for property affected by the flood waters are still being tallied as of October 22nd, 202511, but thankfully reports released prior to the publication of this rapid assessment suggest that there were no lives lost in this extreme event.
The past two decades of frequent drought and increasing threat of wildfire, in addition to this recent flooding event, provide a glimpse into the risk of natural hazards that rural mountain communities face in the Southwest. As communities in the region rebuild and plan for the future, regional trends in temperatures are likely to amplify the risks of heavy precipitation events and subsequent flooding 12. A warmer atmosphere can hold more water, creating the potential for increased precipitation from intense storms. Resilience to these future risks can be built by providing communities with the best available science to communities, using that information to assess exposure to hazards, and supporting actionable planning. As part of our core program activities, Western Water Assessment works with communities to offer expert scientific support for understanding risk and building local resilience across Colorado, Utah, and Wyoming.
For further information or inquiry on the above assessment or how WWA can support your community, please reach out to Nels Bjarke (Nels.Bjarke@colorado.edu) or Seth Arens (Seth.Arens@colorado.edu).
Acknowledgments
We thank the experts who were able to review the contents of this report to allow for its timely publication, including Dr. Ben Livneh, Dr. Benét Duncan, and Dr. Katherine Clifford. Western Water Assessment is part of the Cooperative Institute for Research in Environmental Sciences (CIRES) at the University of Colorado Boulder, the University of Utah, and the University of Wyoming. Our primary source of funding is the NOAA Climate Adaptation Partnerships (CAP) program, formerly known as the RISA program. We are one of several CAP/RISA teams operating across the U.S. to help communities and local decision makers better understand, plan for, and respond to extreme events and natural hazards. 13
Data Sources, Methods, and Notes
Precipitation: Precipitation data were collected from the national weather service stations for Wolf Creek Pass (https://www.weather.gov/wrh/timeseries?site=KCPW), located within the high elevation area of the watershed that feeds into the San Juan River that flows through Pagosa Springs, and Steven’s Field (https://www.weather.gov/wrh/timeseries?site=KPSO), located adjacent to the city of Pagosa Springs. These data are derived from stations that use telemetry to upload their data, so while they undergo an initial quality control check, they are still provisional at the time of writing the report.
Runoff: Gauge height records are derived from the USGS Water Data web portal (https://waterdata.usgs.gov/monitoring-location/USGS-09342500/#dataTypeId=continuous-00065-0&period=P7D&showFieldMeasurements=true) 2 to provide hourly gauge height (in feet) from October 9th through October 14th (the time of writing this report). Daily historical records from this gauge are also collected from this source to provide historical information about the gauge height at this location in the past. These records begin in October 1935 and continue to present day. These data are derived from stations that use telemetry to upload their data, so while they undergo an initial quality control check, they are still provisional at the time of writing the report. Flood category heights for this location are derived from the NOAA’s National Water Prediction system (https://water.noaa.gov/gauges/09342500) (https://waterdata.usgs.gov/monitoring-location/USGS-09342500/#dataTypeId=continuous-00065-0&period=P7D&showFieldMeasurements=true) and the Colorado River Basin Forecast Center (https://water.noaa.gov/rfc/CBRFC)
|
Table 2. Daily maximum runoff (cfs) and total daily discharge volume (106 ft3) for the Pagosa Springs USGS stream gauge. Date |
Daily Maximum Runoff (cfs) |
Total Daily Discharge Volume (million cubic-feet) |
|
10/9/25 |
87.6 |
6.97 |
|
10/10/25 |
948 |
31.71 |
|
10/11/25 |
8270 |
316.56 |
|
10/12/25 |
5240 |
291.46 |
|
10/13/25 |
5610 |
285.81 |
|
10/14/25 |
8560 |
568. |